Send telemetry to an OTLP collector
Scenario
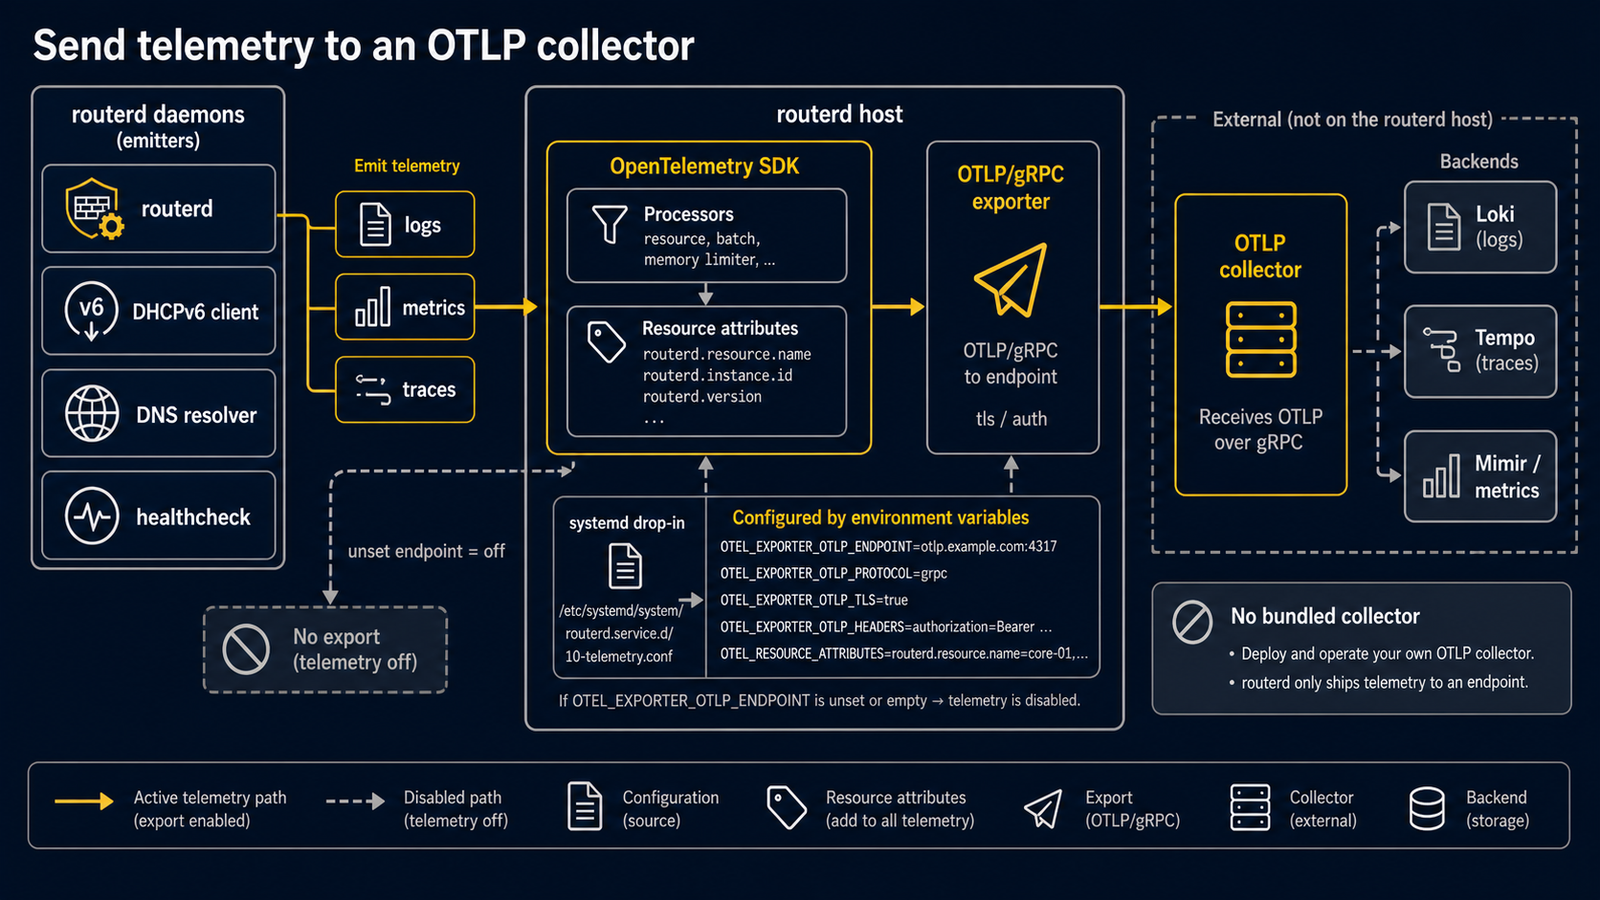
You want to ship the router's logs, metrics, and traces to an OpenTelemetry-compatible backend (Grafana Loki/Tempo/Mimir, Datadog, Honeycomb, a self-hosted otelcol-contrib, …) without having to scrape journalctl or routerctl events.
routerd exposes OpenTelemetry export from every long-running daemon. There is no collector bundled in the router binary — you point routerd at an external OTLP endpoint that you already operate, and routerd sends data over OTLP/gRPC.
What routerd emits
| Daemon | service.name | What you get |
|---|---|---|
routerd (control plane) | routerd | controller.reconcile traces, routerd.controller.reconcile counter, structured slog records |
routerd-dhcpv6-client | routerd-dhcpv6-client | DHCPv6 lifecycle traces and structured logs (Solicit/Request/Renew, lease events) |
routerd-dhcpv4-client | routerd-dhcpv4-client | DHCPv4 lifecycle traces and structured logs |
routerd-pppoe-client | routerd-pppoe-client | PPPoE session lifecycle |
routerd-healthcheck | routerd-healthcheck | Probe results (success/failure with target attributes) |
routerd-eventd | routerd-eventd | Federation delivery metrics (outbox push/receive/TTL/lag counters, loop health, pruner) |
Each daemon adds routerd.resource.name as a resource attribute so you can split signals per resource (e.g. one DHCPv6 client per WAN).
The export is OTLP/gRPC. logs, metrics, and traces share the same endpoint by default; you can point each signal at a different endpoint if your backend prefers it.
Configure the export
routerd reads the standard OpenTelemetry environment variables. There is no routerd-specific syntax to learn; anything the upstream OTLP/gRPC exporter understands works.
The key variables:
| Variable | Purpose |
|---|---|
OTEL_EXPORTER_OTLP_ENDPOINT | One endpoint for all signals (e.g. http://collector.lan:4317) |
OTEL_EXPORTER_OTLP_LOGS_ENDPOINT / _METRICS_ENDPOINT / _TRACES_ENDPOINT | Per-signal override |
OTEL_EXPORTER_OTLP_INSECURE | true to disable TLS (lab use) |
OTEL_EXPORTER_OTLP_HEADERS | e.g. Authorization=Bearer ... for managed backends |
OTEL_SERVICE_NAMESPACE | Recommended: set to routerd so all daemons share a namespace |
OTEL_RESOURCE_ATTRIBUTES | Free-form key=value,... for site/host attributes |
If none of OTEL_EXPORTER_OTLP_ENDPOINT / _LOGS_ENDPOINT / _METRICS_ENDPOINT / _TRACES_ENDPOINT is set, routerd skips telemetry initialization entirely. There is no per-daemon "off" switch — leaving the variables unset is the off state.
Apply the variables to a systemd-managed routerd
On Linux installations the variables go into the systemd unit's environment. The cleanest place is a drop-in so an upstream unit refresh doesn't overwrite them:
# /etc/systemd/system/routerd.service.d/10-otel.conf
[Service]
Environment=OTEL_EXPORTER_OTLP_ENDPOINT=http://collector.lan:4317
Environment=OTEL_EXPORTER_OTLP_INSECURE=true
Environment=OTEL_SERVICE_NAMESPACE=routerd
Environment=OTEL_RESOURCE_ATTRIBUTES=deployment.environment=home,host.name=edge-router
Repeat the same drop-in for every managed daemon you want to export from:
/etc/systemd/system/[email protected]/10-otel.conf/etc/systemd/system/[email protected]/10-otel.conf/etc/systemd/system/[email protected]/10-otel.conf/etc/systemd/system/[email protected]/10-otel.conf
Then:
sudo systemctl daemon-reload
sudo systemctl restart routerd.service \
                       'routerd-dhcpv6-client@*.service' \
                       'routerd-healthcheck@*.service'
FreeBSD
In the rc.d wrapper that routerd renders for each daemon, add the variables to the command_args environment block (or use routerd_envfile=... if your wrapper supports it).
Run a receiver to verify
Any OTLP/gRPC backend works. The simplest one for a smoke test is otelcol-contrib with a debug exporter:
# /tmp/otel-test.yaml
receivers:
  otlp:
    protocols:
      grpc:
        endpoint: 0.0.0.0:4317

exporters:
  debug:
    verbosity: detailed

service:
  pipelines:
    logs:    { receivers: [otlp], exporters: [debug] }
    metrics: { receivers: [otlp], exporters: [debug] }
    traces:  { receivers: [otlp], exporters: [debug] }
otelcol-contrib --config /tmp/otel-test.yaml
After restarting routerd you should see, within a few seconds:
routerd.controller.reconcileSum metric, increasing over timecontroller.reconcilespans with status OK- routerd's slog records as
LogRecordentries
If you only see records from routerd itself but the per-daemon services are silent, double-check that the per-daemon drop-ins were applied and that daemon-reload ran.
Troubleshooting
"address family not supported by protocol" in a daemon's journal. Current
routerd-generated systemd units do not restrict address families. Check for an
older local unit or drop-in that still sets RestrictAddressFamilies, then
remove that override and run systemctl daemon-reload.
No data at the collector. Check that the endpoint is a hostname/IP routerd can reach (test with getent ahosts and nc -vz host port), and that OTEL_EXPORTER_OTLP_INSECURE=true is set when you skip TLS.
Records come through but service.name is wrong. Each daemon sets its own service.name; you can add OTEL_RESOURCE_ATTRIBUTES=service.namespace=routerd,... to group them in the backend, but do not override service.name itself.
What routerd does not ship
- A bundled OTLP collector. Run one alongside routerd or use a managed backend.
- A built-in storage backend. routerd has its own SQLite log databases (
events.db,dns-queries.db,traffic-flows.db,firewall-logs.db) for local visibility through the Web Console; OTLP export is for sending the same data outside the host.
Declarative Telemetry resource
Use Telemetry to describe the OTLP endpoint in router YAML. routerd injects the matching OpenTelemetry environment variables into generated systemd and FreeBSD rc.d units. The collector is still external; routerd only prepares the exporter configuration.
apiVersion: observability.routerd.net/v1alpha1
kind: Telemetry
metadata:
  name: otlp
spec:
  otlp:
    endpoint: http://collector.example.internal:4317
    insecure: true
  serviceNamespace: routerd
  attributes:
    deployment.environment: home
    site: edge
  signals: [logs, metrics, traces]
Use ObservabilityPipeline when you also want routerd to forward its internal
event stream to stdout, syslog, or Loki without adding a separate local
collector. See Observability pipeline.