OpenTelemetry 仪表板
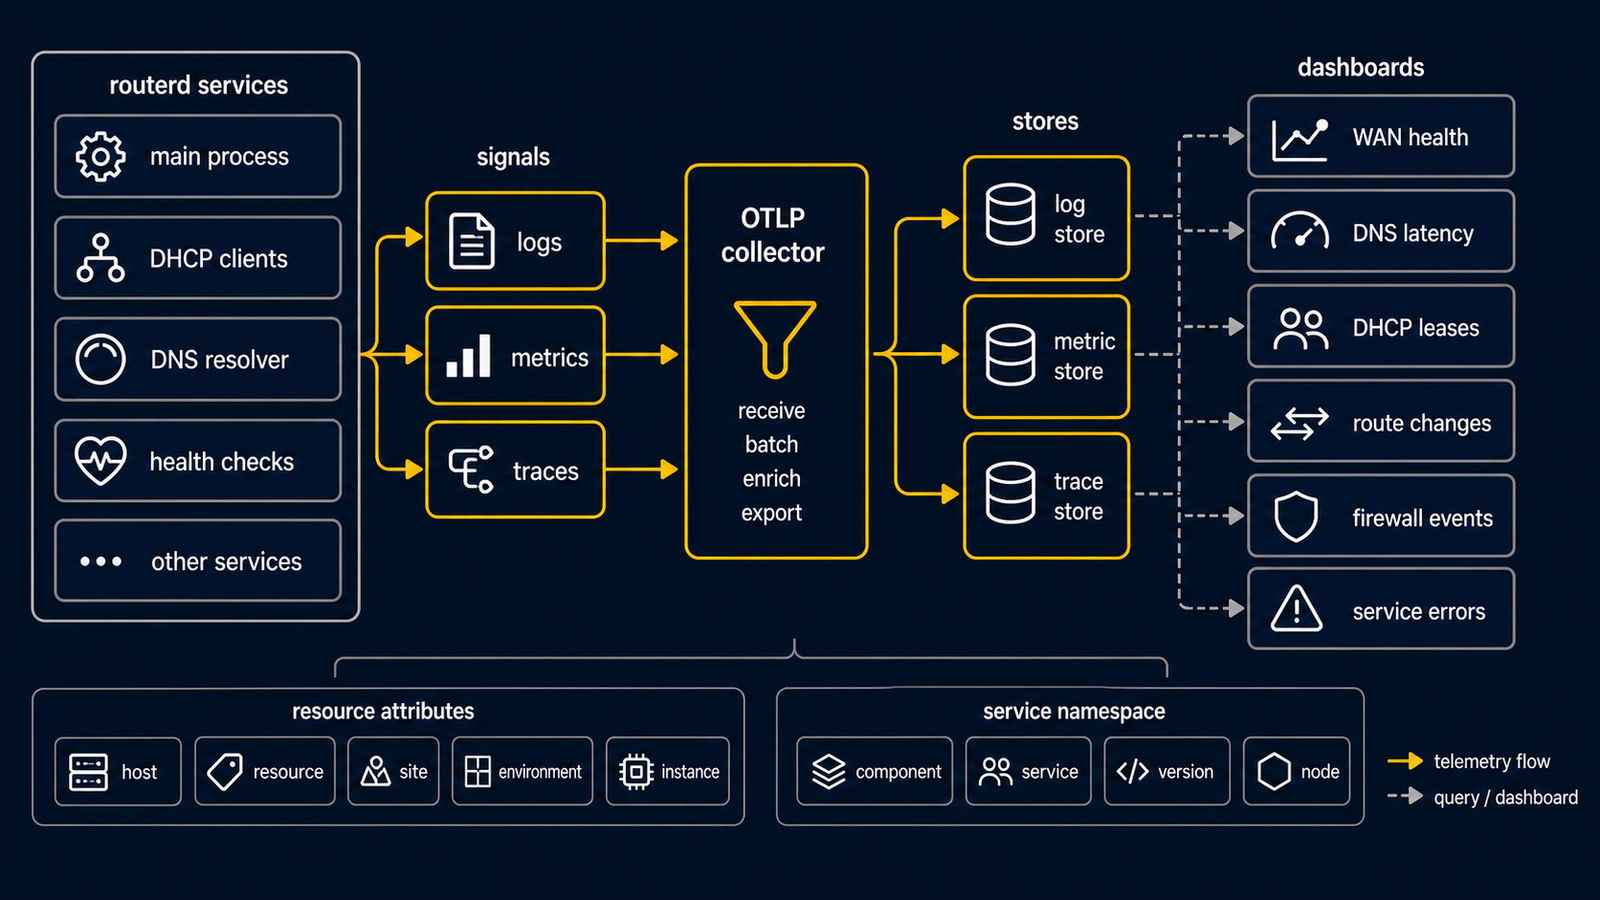
routerd 以 routerd.<domain>.<metric> 命名规则输出指标。
您可在 Grafana、OpenObserve 或其他 OTLP 指标后端使用下列面板作为起点。
| 面板 | 指标 |
|---|---|
| 控制器 dry-run 次数 | routerd.controller.dry_run.count |
| 资源 phase | routerd.resource.phase.count(依 routerd.resource.phase 分组) |
| 活跃的 DHCP 租约 | routerd.dhcp.lease.active(依 network.address.family 分组) |
| sticky DHCP hold | routerd.dhcp.sticky.held(依 network.address.family 分组) |
| 活跃的客户端 | routerd.client.active.count |
| BGP peer 与前缀 | routerd.bgp.peer.established / routerd.bgp.prefix.accepted |
| VIP 与 ingress 故障切换 | routerd.vip.active / routerd.ingress.service.active / routerd.ingress.backend.healthy |
| conntrack 使用量 | routerd.conntrack.count / routerd.conntrack.max |
| 防火墙拒绝 | routerd.firewall.deny.total(依 network.protocol.name 分组) |
资源属性包含 service.name、service.version、host.name、routerd.host.role、routerd.os。
PromQL 格式的查询示例如下:
routerd_resource_phase_count
routerd_dhcp_lease_active{network_address_family="ipv4"}
routerd_dhcp_sticky_held
rate(routerd_firewall_deny_total[5m])